Using Trigonometry to Animate Bounces, Draw Clocks, and Point Cannons at a Target
Posted by Al Sweigart in misc
About Trigonometry
(Links to the Python programs in this tutorial. Requires Python and Pygame to be installed.)
- trig_bounce.py
- trig_waves.py
- trig_circle.py
- trig_clock.py
- trig_cannons.py
- trig_eyes.py
- trig_redcenter.py
Trigonometry is the branch of mathematics that studies triangles and the relationships between their sides and the angles between these sides. The sine, cosine, and tangent trigonometry functions are implemented as programming functions in most languages and given the names sin(), cos(), and tan(). In Python, these functions exist in the math module. These functions are very handy in games and graphical programs because of the smooth wave-like pattern their return values produce.
This tutorial shows how you can get a variety of neat animation behavior using these functions in your programs. (The animated gifs you see above were taken from the programs in this tutorial.) The code examples in this tutorial should work with both Python 2 and Python 3.
Trig Function Basics
You don't need to know how these functions work. Let's just treat these functions as black boxes: they take one number parameter in, and return a float value out. If you already know the mathematics of sine and cosine, then you can just skim this section.
In the interactive shell, let's see what math.sin() returns for some values:
>>> import math

>>> math.sin(1)

0.8414709848078965

>>> math.sin(2)

0.90929742682568171

>>> math.sin(3)

0.14112000805986721

>>> math.sin(4)

-0.7568024953079282

>>> math.sin(5)

-0.95892427466313845
It looks like math.sin() just spits out some random-looking float values. (Actually, it's the length of the opposite side divided by the hypotenuse of a right triangle with the given angle. But you don't need to know or understand this.) But if we graph the return values of the input arguments 1 through 10 on a graph, we can see the pattern:

If you figure out the sine values for some more numbers (for example, 1.5 and 1.5 and so on) and then connect the dots with lines, you can see this wave pattern more easily:
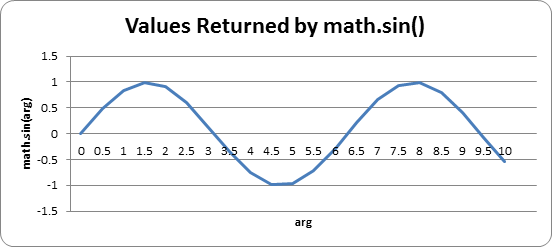
In fact, if you kept adding more and more data points to this graph, you would see that the complete sine wave looks like this:

The significant input/output pairs for sine are:
| Math Function | Python Code | Return Value |
| sine of 0 | math.sin(0) |
0 |
| sine of π / 2 | math.sin(math.pi / 2) |
1 |
| sine of π | math.sin(math.pi) |
0 |
| sine of 3π / 2 | math.sin(3 * math.pi / 2) |
-1 |
| sine of 2π | math.sin(2 * math.pi) |
0 |
Notice that math.sin(0) returns 0, then the return value gradually increases until math.sin(3.14 / 2) (that is, half of pi) returns 1, then it begins to decrease until math.sin(3.14) returns 0. (The number 3.14 is a special number in mathematics called pi (pronounced the same as delicious "pie".) This value is stored in the variable pi in the math module and has the float value 3.1415926535897931.

The pattern of return values for math.cos() looks similar, it just runs a little bit behind the sine wave:

This wavey-looking pattern of return values makes math.sin() and math.cos() pretty handy for a few graphics and animation programming techniques. The core benefit is that these are functions can take a linearly changing (that is, changes at a set rate) input and give an output that oscillates between -1.0 and 1.0.
Bouncing Animation with Sine and Cosine
Our first programming example shows some simple bouncing animation (though technically not a parabola, but though not physics-precise this bounce is simple to implement):

Download the Python source code for trig_bounce.py.
Here's the main part of the code for the blue bouncing ball's Y position:
    yPos = -1 * math.sin(step) * AMPLITUDE


    ...some other code...


    step += 0.02
When we call the math.sin() function, we pass it step for the argument. The step variable starts at 0 and is incremented on line 65 by 0.02. So the calls to math.sin() are: math.sin(0), math.sin(0.02), math.sin(0.04), and so on.
The return value (that is, the output) is used for the Y coordinate. It is multiplied by -1 because in Pygame (and most programming languages) the Y coordinate increases going down. This is the opposite direction used in Cartesian coordinates in your math class.
The return value is also multiplied by the value in the AMPLITUDE variable, so that instead of ranging over -1.0 to 1.0, it will range between (-1.0 * AMPLITUDE) to (1.0 * AMPLITUDE). Which is to say, it ranges from -AMPLITUDE to AMPLITUDE. Since we set AMPLITUDE to 100 on line 29 of trig_bounce.py, this causes the Y coordinate to move over a range of 200 pixels (from a Y coordinate of -100 to 100). If we increase AMPLITUDE, then the ball will move over a larger range (and move faster, since it covers a larger distance in the same amount of time).
Things to note:
- Increasing
AMPLITUDE= Increasing the range that the ball moves over. - Increasing
AMPLITUDE= Increasing the speed that the ball moves (since it moves over a larger range in the same time as before). - Increasing the amount
stepincrements by = Increases the speed the ball moves.
On line 55, we pass the red ball's math.sin() return value to abs() which makes sure any negative return value is converted to a positive number. This is what causes the red ball to "bounce" instead of oscillate like the blue ball.
Changing the Amplitude and Frequency of the Waves
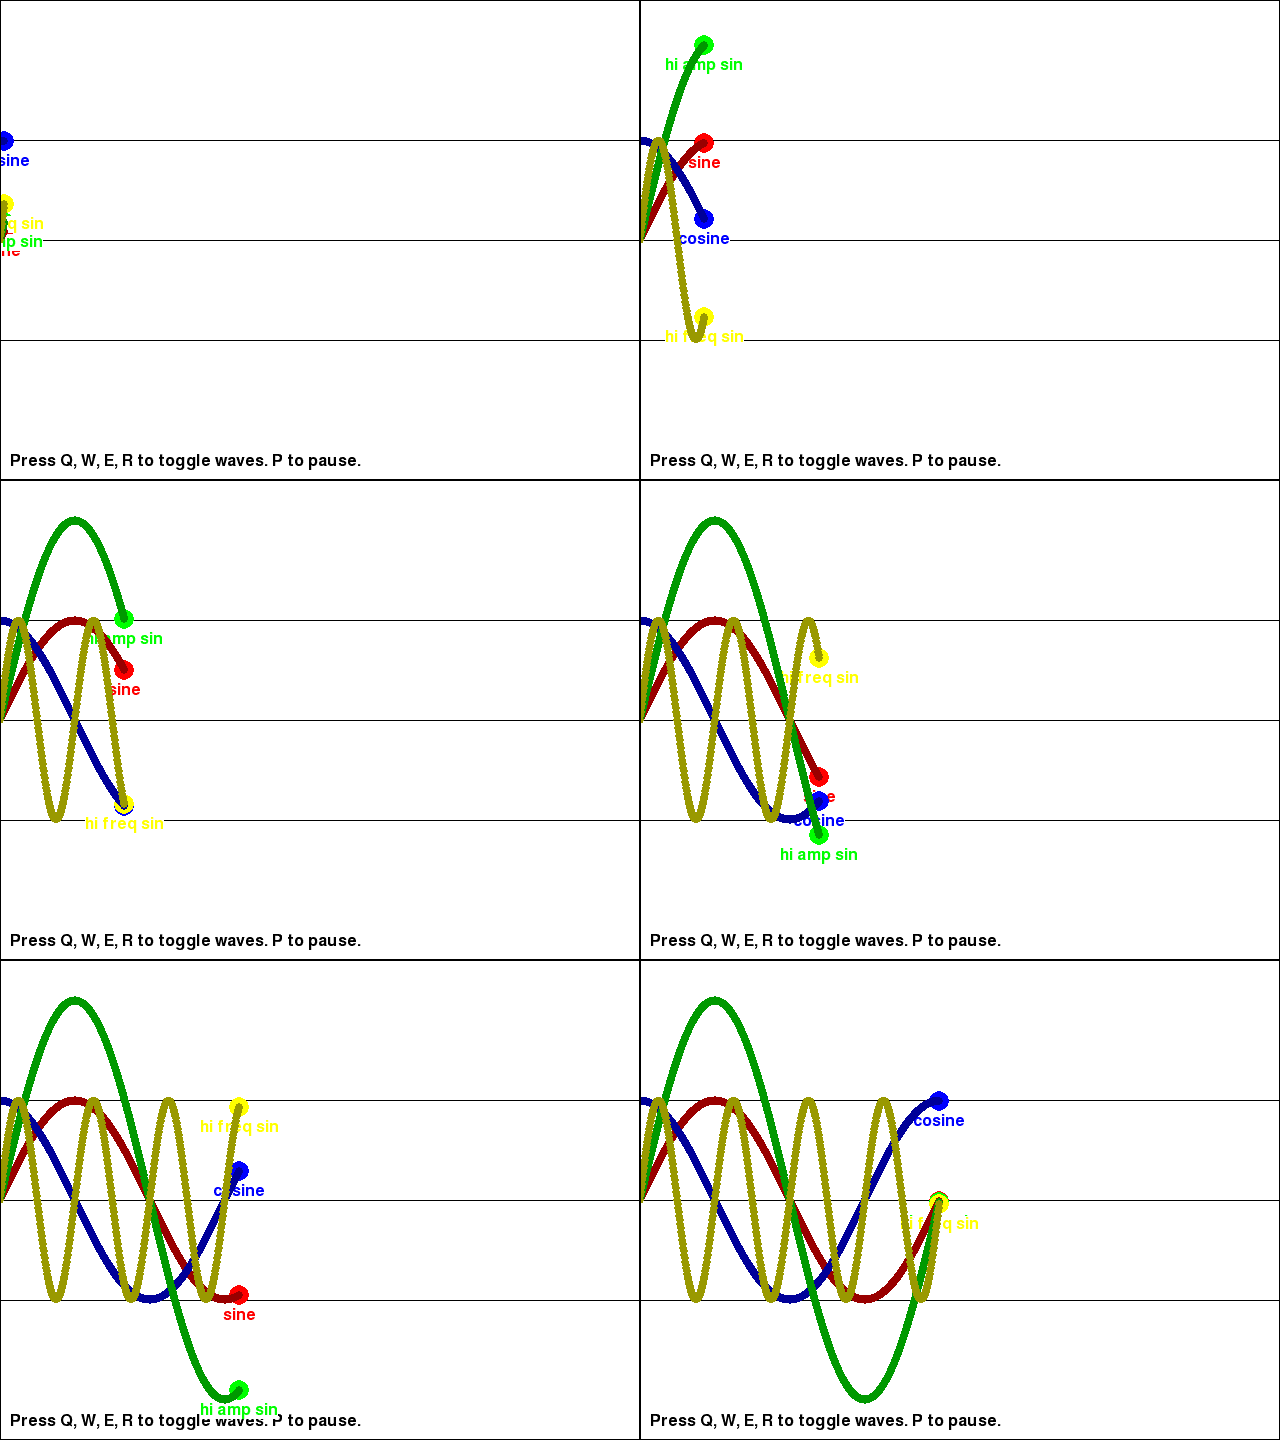
You can see the return values for the math.sin() and math.cos() functions (as well as the return value of math.sin() multiplied by a large amplitude value, and the return value of math.sin() with a larger input parameter to increase the wave's frequency) in the trig_waves.py program:

Download the Python source code for trig_waves.py.
As you can see, the cosine wave is exactly the same as the sine wave, except a little further behind it. Take a look at the source code to see how we can adjust the math.sin() calls to change the shape of the wave.
    # sine wave

    yPos = -1 * math.sin(step) * AMPLITUDE


    ...some other code...


    # high amplitude sine wave

    yPos = -1 * math.sin(step) * (AMPLITUDE + 100) # Note the "+ 100" to the amplitude!


    ...some other code...


    # high frequency sine wave

    yPos = -1 * math.sin(step * 4) * AMPLITUDE # Note the "* 4" to the frequency
Moving in a Circle
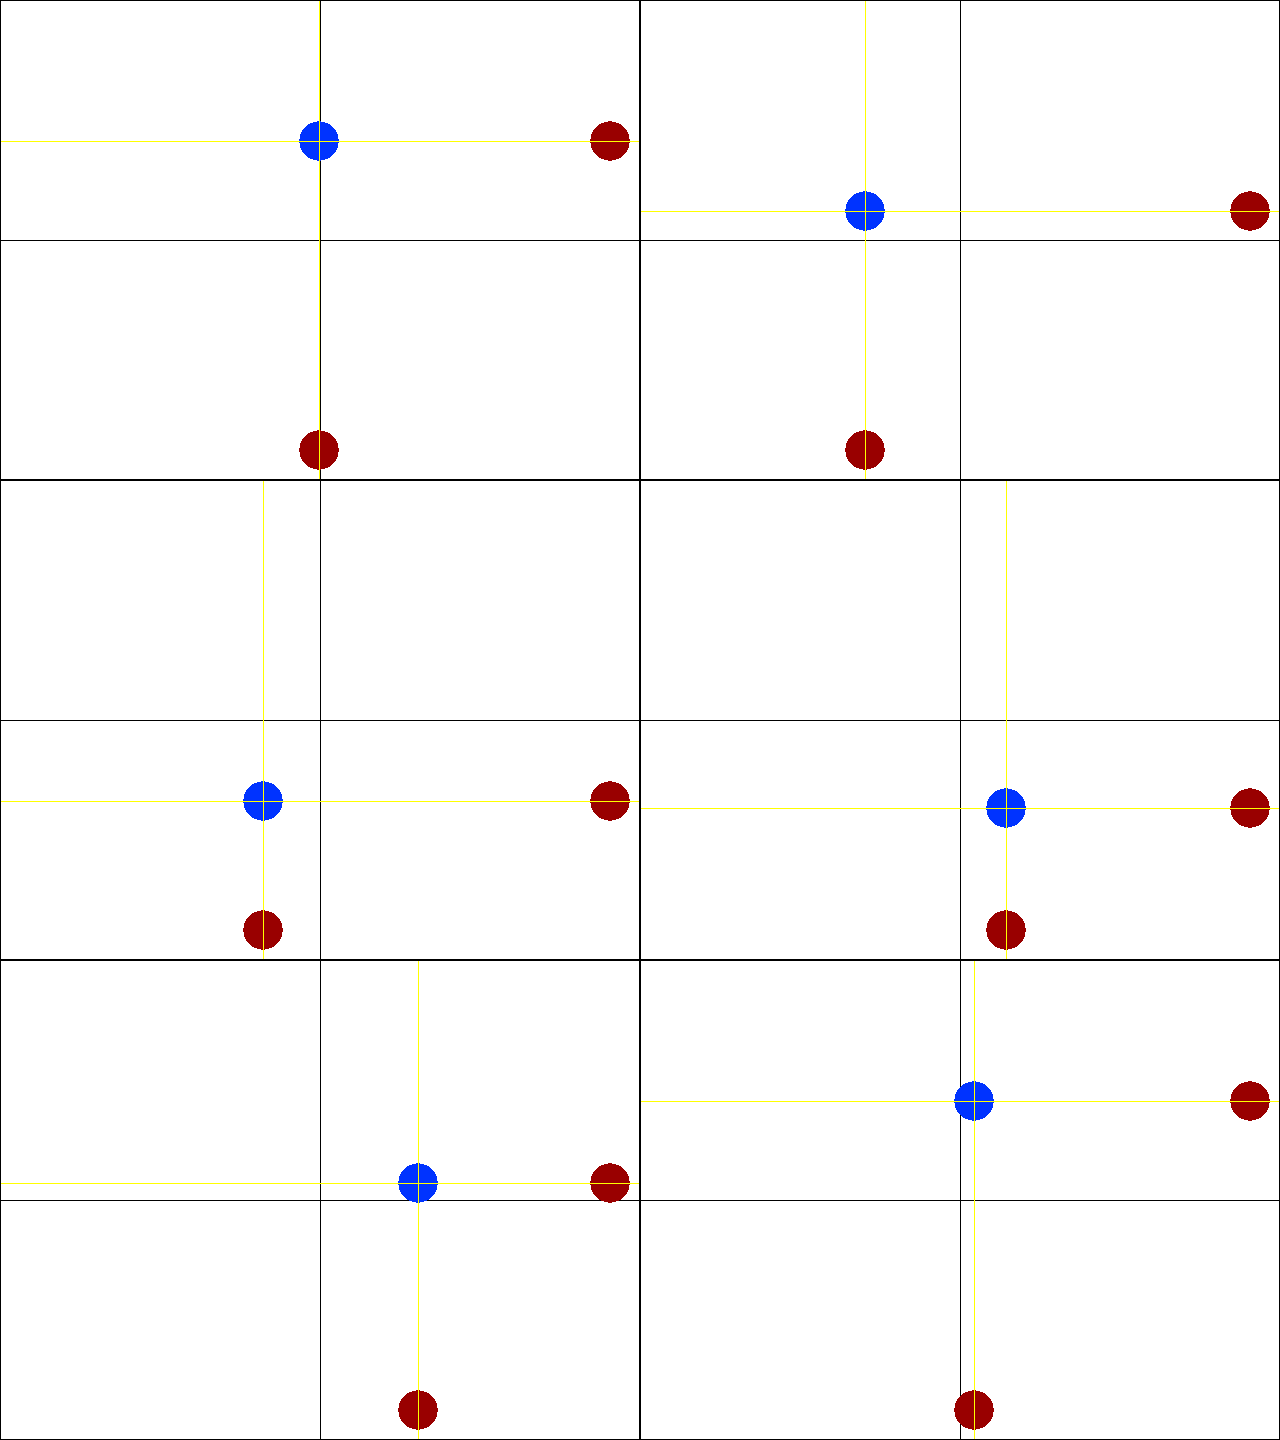
The cosine functions can be used for getting the X and Y coordinates of a circle. The trig_circle.py program shows a ball moving in a circle (along with two other balls that are moving only along the X-axis and only along the Y-axis).

Download the Python source code for trig_circle.py.
In trig_circle.py, these are lines 56 to 60:
    # draw blue ball

    xPos =      math.cos(step) * AMPLITUDE

    yPos = -1 * math.sin(step) * AMPLITUDE

    #yPos = -1 * abs(math.sin(step) * AMPLITUDE) # uncomment this line to make the ball bounce

    pygame.draw.circle(DISPLAYSURF, BRIGHTBLUE, (int(xPos) + WIN_CENTERX, int(yPos) + WIN_CENTERY), 20)
Remember, the multiplication by -1 for yPos is because Pygame's Y coordinates increase going down. Note that the xPos and yPos variables are converted to integers and added to WIN_CENTERX and WIN_CENTERY before being passed to pygame.draw.circle(). While multiplying the input argument will increase the amplitude of the wave, adding a number to the output will move the coordinate (this is called translation). Since we want the ball's X and Y coordinates to be in the center of the window, we add WIN_CENTERX and WIN_CENTERY to them.
You can see the vertical component of this movement with the ball drawn by lines 62 and 63:
    # draw vertically moving red ball

    pygame.draw.circle(DISPLAYSURF, DARKRED, (WINDOWWIDTH - 30, int(yPos) + WIN_CENTERY), 20)
You can see the horizontal component of the circular movement with the ball drawn by lines 65 and 66:
    # draw horizontally moving red ball

    pygame.draw.circle(DISPLAYSURF, DARKRED, (int(xPos) + WIN_CENTERX, WINDOWHEIGHT - 30), 20)
If you uncomment the second yPos assignment statement, the Y coordinate will be set to the absolute value of the previous calculation. This causes the blue ball to bounce back and forth, since the Y coordinate can never become negative. Try uncommenting this line and re-running the program.
Note: When you use math.cos() to calculate the X coordinate and math.sin() to calculate the Y coordinate, using an argument of 0 returns the coordinates of the right edge of the circle and goes counter-clockwise as you increment the argument.
If you use math.sin() to calculate the X coordinate and math.cos() to calculate the Y coordinate, passing an argument of 0 returns the coordinates of the top edge of the circle and goes clockwise as you increment the argument.
Making An Analog Clock Program
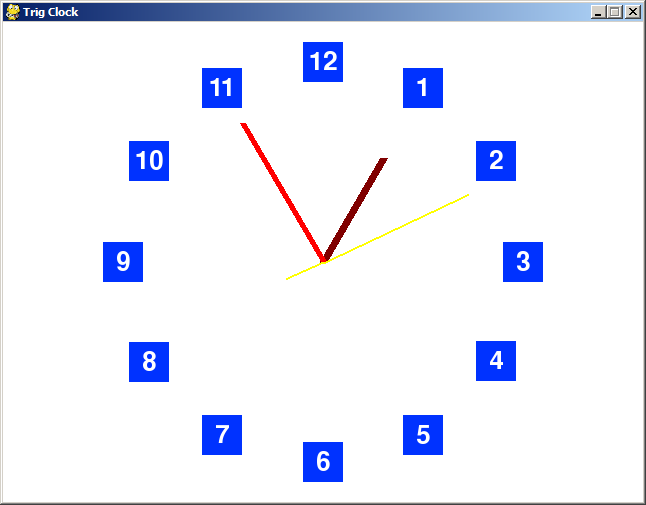
If you look at the Windows clock (or whatever system clock your OS has), you'll notice that it draws a line from the center of the clock to the numbers that are laid out around the clock. Pygame already provides function that can draw a line if you give it the X and Y coordinates for the two ends of the line.
The numbers of the clock are arranged in a circle, so we can use math.sin() and math.cos() to get the X and Y coordinates for the other end of the line. You can also use the trig functions to figure out the X and Y coordinates of the numbers.

Download the Python source code for trig_clock.py.
The main part of the program is the getTickPosition() function. This returns the X and Y coordinate of a "tick" position of a clock, which we define as starting at 0 at the top of the clock and increasing in a clockwise direction.
# This function retrieves the x, y coordinates based on a "tick" mark, which ranges between 0 and 60

# A "tick" of 0 is at the top of the circle, 30 is at the bottom, 45 is at the "9 o'clock" position, etc.

# The "stretch" is how far from the origin the x, y return values will be

# "originx" and "originy" will be where the center of the circle is (almost always the center of the window)

def getTickPosition(tick, stretch=1.0, originx=WIN_CENTERX, originy=WIN_CENTERY):

    # uncomment to have a "rotating clock" feature.

    # This works by pushing the "tick" amount forward

    #tick += (time.time() % 15) * 4


    # The cos() and sin()

    tick -= 15


    # ensure that tick is between 0 and 60

    tick = tick % 60


    tick = 60 - tick


    # the argument to sin() or cos() needs to range between 0 and 2 * math.pi

    # Since tick is always between 0 and 60, (tick / 60.0) will always be between 0.0 and 1.0

    # The (tick / 60.0) lets us break up the range between 0 and 2 * math.pi into 60 increments.

    x =      math.cos(2 * math.pi * (tick / 60.0))

    y = -1 * math.sin(2 * math.pi * (tick / 60.0)) # "-1 *" because in Pygame, the y coordinates increase going down (the opposite of how they normally go in mathematics)


    # sin() and cos() return a number between -1.0 and 1.0, so multiply to stretch it out.

    x *= stretch

    y *= stretch


    # Then do the translation (i.e. sliding) of the x and y points.

    # NOTE: Always do the translation addition AFTER doing the stretch.

    x += originx

    y += originy


    return x, y
Also notice in the source code there are three lines that you can uncomment to apply different animation effects to the clock. Go ahead and experiment with them:
    # uncomment to have a "rotating clock" feature.

    # This works by pushing the "tick" amount forward

    #tick += (time.time() % 15) * 4


    ...some other code...


    # Uncomment this if you don't want the second hand to move smoothly:

    #now_second = now[5]


    ...some other code...


    # Uncomment this if you want the "pulsing clock" feature:

    #CLOCKSIZE = originalClockSize + math.sin(2 * math.pi * (time.time() % 1)) * PULSESIZE
Pointing Cannons at a Target

Download the Python source code for trig_circle.py.
There is another trig function called tangent and its inverse, arctangent. In Python, this is implemented in the math.tan() and math.atan() functions. One very useful thing that the tangent functions are good for finding the amount of rotation needed to point an object at another, given their X and Y coordinates. The Python function I've implemented for this makes use of the math.atan2() function (an arctangent function with x and y parameters rather than a single radian parameter) in lines 45 to 52 of trig_cannons.py:
def getAngle(x1, y1, x2, y2):

    # Return value is 0 for right, 90 for up, 180 for left, and 270 for down (and all values between 0 and 360)

    rise = y1 - y2

    run = x1 - x2

    angle = math.atan2(run, rise) # get the angle in radians

    angle = angle * (180 / math.pi) # convert to degrees

    angle = (angle + 90) % 360 # adjust for a right-facing sprite

    return angle
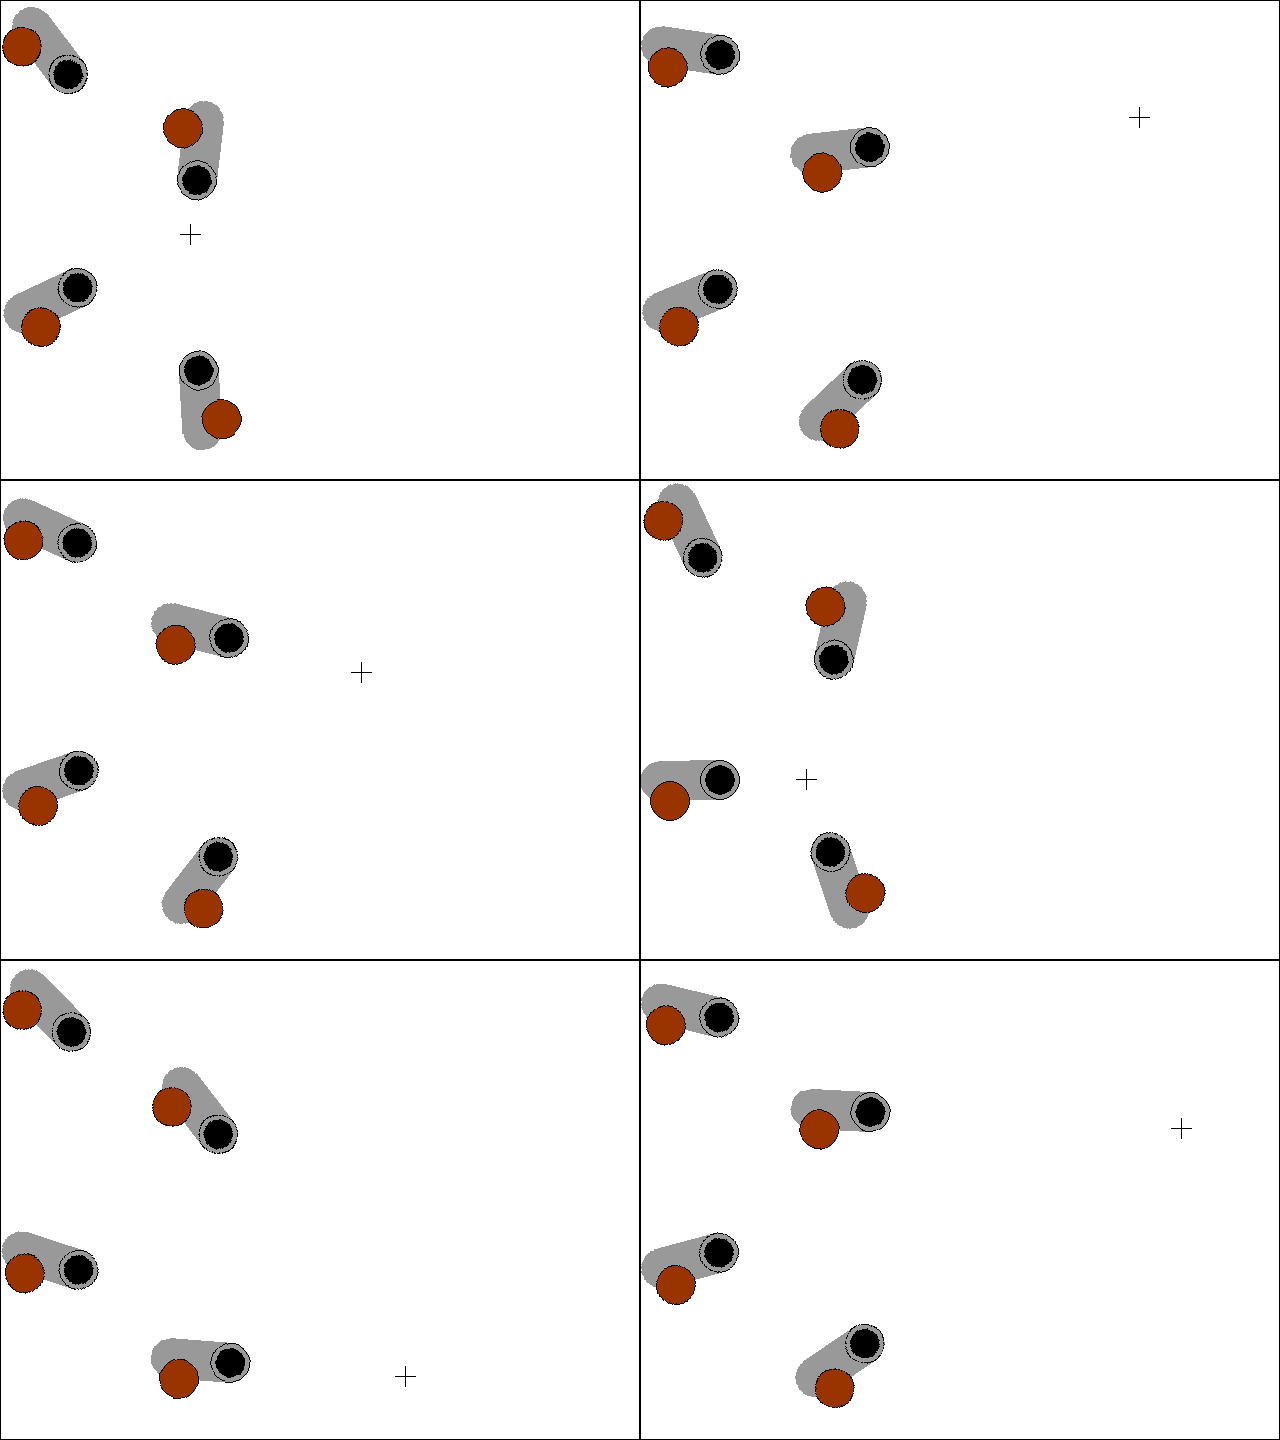
The getAngle() function takes in the X and Y coordinates of two points, and returns the number of degrees that the object at the first point should be rotated to be pointing at the second point.
With the code in getAngle(), we can set up several different cannons on the screen and have them always pointed at the mouse cursor by rotating the cannon's image (on its Surface object) by the return value of getAngle(). That is what this code does:
        degrees = getAngle(cannonx, cannony, mousex, mousey)


        # rotate a copy of the cannon image and draw it

        rotatedSurf = pygame.transform.rotate(cannonSurf, degrees)
Remember to pass the cannon's X and Y coordinates as the first pair of arguments to getAngle(), otherwise you will get the angle that the mouse cursor would rotate to point to the cannon instead of vice versa.
Red Orbiting Circle
The trig_redcenter.py program is a simplified version of the code that will be in the "following eyes" program next. The basic idea of this program is to get the angle between the mouse cursor and the center of the window (which involves calling the math.atan2() function). Then a red circle is placed a constant distance away from the center at this angle (which involves math.cos() and math.sin(), since all the points a constant distance from one point forms a circle.)

Download the Python source code for trig_redcenter.py.
    # draw the cannons pointed at the mouse cursor

    mousex, mousey = pygame.mouse.get_pos()


    degrees = getAngle(WIN_CENTERX, WIN_CENTERY, mousex, mousey)


    # draw the thin central red circle

    pygame.draw.circle(DISPLAYSURF, RED, (WIN_CENTERX, WIN_CENTERY), 100, 4)


    # draw the big circle on the edge

    xPos = math.cos(degrees * (math.pi / 180)) * 100

    yPos = math.sin(degrees * (math.pi / 180)) * 100

    pygame.draw.circle(DISPLAYSURF, RED, (int(xPos) + WIN_CENTERX, -1 * int(yPos) + WIN_CENTERY), 40)
This makes it look like the mouse is sliding the big red circle along the thing circle. This effect will be used in the next program.
Eyes Following the Mouse Cursor
The trig_eyes.py program uses this same getAngle() function to make eyes that will follow the mouse pointer. You can see that the solid black circle of the eyeball has it's center X and Y coordinates set by this code:
        degrees = getAngle(eyex, eyey, mousex, mousey)


        # draw the outline of the eye

        pygame.draw.circle(DISPLAYSURF, BLACK, (eyex, eyey), 15, 1)


        # draw the black part of the eye

        xPos = math.cos(degrees * (math.pi / 180)) * 5

        yPos = math.sin(degrees * (math.pi / 180)) * 5

        pygame.draw.circle(DISPLAYSURF, BLACK, (int(xPos) + eyex, -1 * int(yPos) + eyey), 10)
To make the eyes "follow" the mouse cursor, we need to have the pupil circle be a constant distance from the center of the eye. We do this with code similar to the code in trig_redcenter.py. We just make sure this distance and the radius of the pupil circles adds up to the radius of the outline circle of the eye. That way the pupil will always be at the edge of the eye outline.
When we put two of these together, they look like a pair of eyes following the mouse circle.
Conclusion
There aren't many times that you need to know complex math in programming. But the basic trig functions that programming languages provide are very helpful for various graphics and animation techniques like the ones outlined here. I hope this tutorial has been helpful. Feel free to ask any further questions in the comments or email me. [email protected]

