Use this link to get 70% off the Automate the Boring Stuff online video course.
Support me on Patreon


IDLE includes a built-in debugger that allows you to execute your program one line at a time, making the debugger a valuable tool for finding bugs in your program. By running your program in debug mode, you can take as much time as you want to examine the values in the variables at any given point while the program is running.
In this appendix, you’ll learn about how the debugger works, then practice debugging a program from the book, and finally learn how to set breakpoints in your code for easier debugging.
To enable IDLE’s debugger, click Debug▸Debugger in the interactive shell window. The Debug Control window should appear, as shown in Figure A-1.
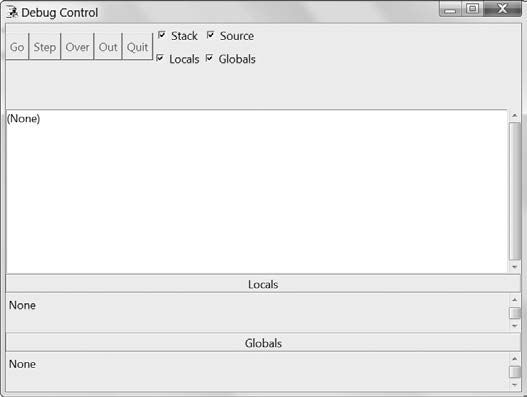
Figure A-1: The Debug Control window
In the Debug Control window, select the Stack, Locals, Source, and Globals checkboxes to display the full set of debugging information. When the Debug Control window is visible, anytime you run a program from the file editor, the debugger pauses execution before the first instruction and displays the following:
The line of code that is about to be executed
A list of all local variables and their values
A list of all global variables and their values
When you run a program in debug mode, you’ll notice that within the list of global variables are several variables you haven’t defined in your program, such as __builtins__, __doc__, __file__, and so on. The meaning of these variables is beyond the scope of this book, so just ignore them.
The program will remain paused until you click one of the five buttons in the Debug Control window: Go, Step, Over, Out, or Quit. Let’s explore each button in turn.
The Go button
The Go button executes the program normally until it terminates or reaches a breakpoint. A breakpoint is a specific line of code you designate to force the debugger to pause whenever the program execution reaches that line. We’ll look at breakpoints in more detail in “Setting Breakpoints” on page 379. When you want the program to continue execution after a pausing at a breakpoint, click the Go button again.
The Step button
Clicking the Step button executes just the next line of code. After that line executes, the program pauses again. The Debug Control window’s list of global and local variables will update at this point if their values have changed. If the next line of code is a function call, the debugger will step into that function and jump to that function’s first line of code. It will do this even if the function is contained in a separate module or is one of Python’s built-in functions.
The Over button
Similar to the Step button, the Over button also executes the next line of code; however, when the next line of code is a function call, clicking the Over button steps over the code inside the function. The code inside the function will execute at full speed, and the debugger will pause as soon as the function call returns. For example, if the next line of code is a print() call, you don’t need to review code inside the built-in print() function: you just want the string you pass it printed to the screen. For this reason, you’ll use the Over button more often than the Step button.
The Out button
Clicking the Out button causes the debugger to execute lines of code at full speed until it returns from the current function. If you’ve stepped into a function call using the Step button and then want to continue executing instructions until you get back out, you can click the Out button to step out of the current function call.
The Quit button
To stop debugging entirely and exit the program right away, click the Quit button. The Quit button immediately terminates the program. To run your program normally again, click Debug▸Debugger to disable the debugger.
Let’s try to debug one of the programs in the book. Open the reverseCipher.py program from Chapter 4. If you haven’t read Chapter 4 yet, enter the following source code into a file editor window and save it as reverseCipher.py. You can also download this file from https://www.nostarch.com/crackingcodes/.
reverseCipher.py
1. # Reverse Cipher
2. # https://www.nostarch.com/crackingcodes/ (BSD Licensed)
3.
4. message = 'Three can keep a secret, if two of them are dead.'
5. translated = ''
6.
7. i = len(message) - 1
8. while i >= 0:
9. translated = translated + message[i]
10. i = i - 1
11.
12. print(translated)
Click Debug▸Debugger in the interactive shell window. When you press F5 or click Run▸Run Module to run the program, it should start in a paused state on line 4. Lines 1 to 3 in this program are comments and blank lines, so the debugger automatically skips them. The debugger always pauses on the line of code it is about to execute. Figure A-2 shows what the Debug Control window should look like.
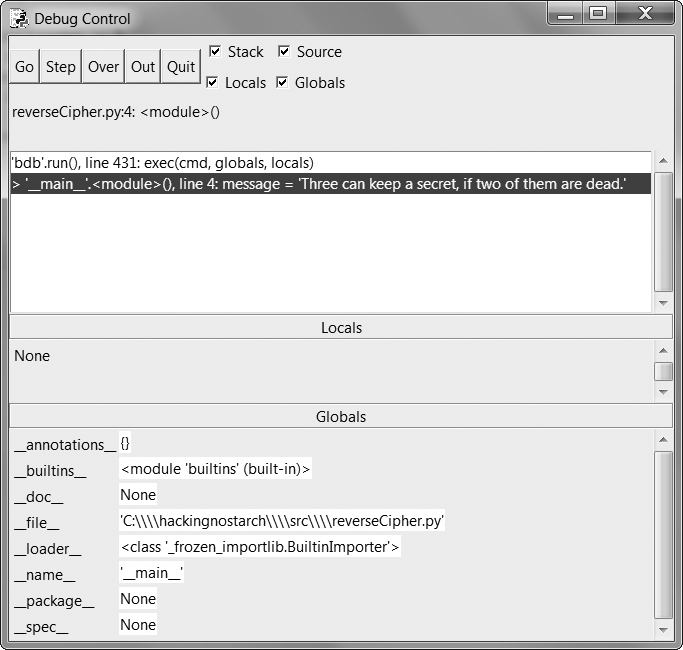
Figure A-2: The Debug Control window when the program first starts in the debugger
Click the Over button once to execute line 4, which assigns 'Three can keep a secret, if two of them are dead.' to the message variable. In the Debug Control window’s Globals section, message should now be listed along with the value it contains.
The Debug Control window then updates to line 5, and line 5 in the file editor window is highlighted, as shown in Figure A-3.
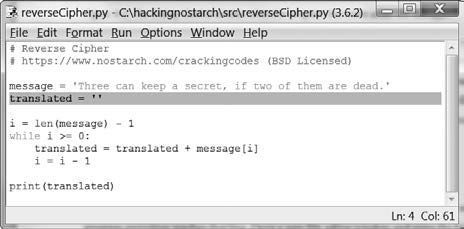
Figure A-3: The reverseCipher.py window with the debugger paused on line 5
The highlight indicates where the program execution is currently. You can continue to execute lines of code one instruction at a time by clicking the Over button. If you want to resume the program at normal speed, click the Go button.
Whenever the debugger pauses, you can look at the values in the program’s variables to see how they have changed with each instruction. When your program has bugs or isn’t doing what you expect, this detailed view of your program as it runs can help you figure out what is going on.
You can set a breakpoint on a specific line of code to force the debugger to pause whenever the program execution reaches that line. Setting a breakpoint allows you to quickly place the debugger near the code you want to debug. To set a breakpoint, right-click the line in the file editor and then click Set Breakpoint. In the reverseCipher.py program, set a breakpoint on line 9, as shown in Figure A-4.
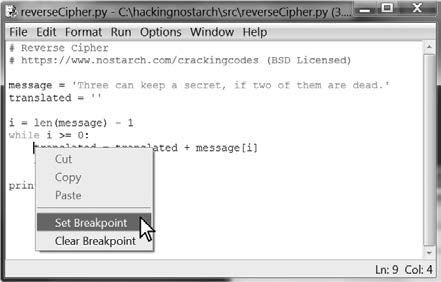
Figure A-4: Setting a breakpoint on line 9 of reverseCipher.py
The line on which you set the breakpoint should now be highlighted in yellow in the file editor. You can set as many breakpoints as you want. When you run the program in the debugger, it will start in a paused state at the first line, as usual. But when you click Go, the program will run at full speed until it pauses on the line with the breakpoint, as shown in Figure A-5.
You can then click Go, Over, Step, or Out to continue program execution. Each time you click Go, the execution continues until it encounters the next breakpoint or the end of the program. In this case, the Globals section will show the translated variable getting longer every time you click Go as new letters are encrypted.
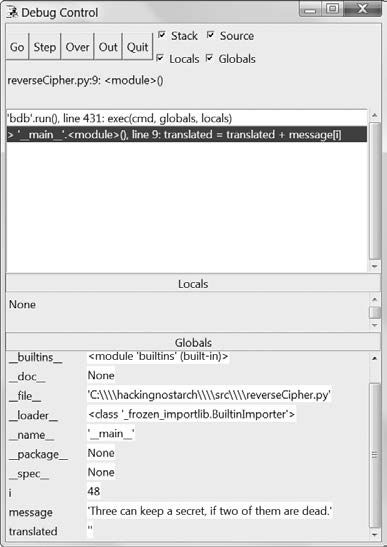
Figure A-5: The debugger pauses the program at the breakpoint on line 9.
To remove a breakpoint, right-click the line in the file editor and then click Clear Breakpoint. The yellow highlight is deleted, and the debugger will not break on that line in the future.
The debugger is a useful tool that lets you step through your program one line at a time. You can use the debugger to run your program at normal speed and pause execution whenever it reaches a line on which you’ve set a breakpoint. The debugger also allows you to see the state of any variable’s value at any point during the program’s execution.
Accidentally introducing bugs into your code is a fact of life, no matter how many years of coding experience you have. Use the debugger to help you understand exactly what is going on in your program so you can fix those bugs.