"Let's Create Software" Tutorial: Bus Routes Overlaid on Google Maps
Posted by Al Sweigart in misc
The "Let's Create Software" series covers the creation of small, complete software projects from start to finish. The entire process and code is explained to give beginner and intermediate programmers an idea of what it is like to not just program, but create an entire piece of software from scratch.
There's a large PDF system map of all the Muni bus routes in San Francisco (as well as maps of the individual Muni routes). If I need to find directions, Google Maps' mass transit instructions are fine. But sometimes I'd like to just browse all the routes throughout the city. However the large PDF is slow to render on my laptop (moreso on my phone). Scrolling the PDF also results in a lengthy wait for redrawing.
So I had the idea to use Google Maps' API to draw out a map of all the Muni routes. This would have the benefit of the system map PDF but also be easier to load and navigate. I have no experience using the Google Maps API and am vaguely aware that there's public data about Muni bus routes, but I'll learn along the way.
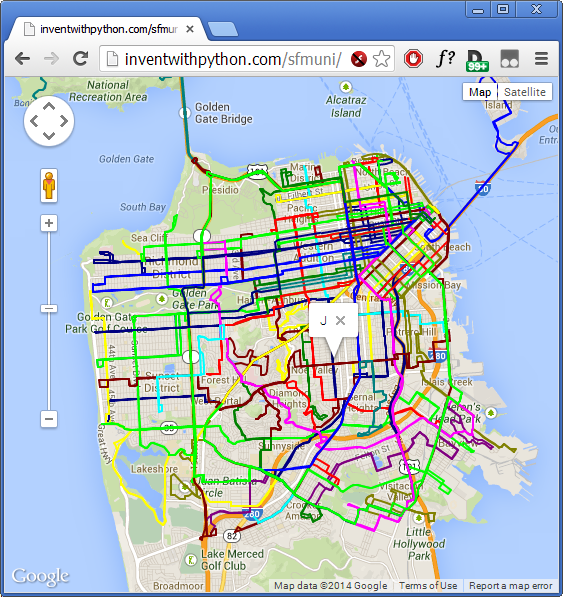
The completed SF Muni Google Map.
To follow along with this tutorial, it helps to have a bit of Python or JavaScript knowledge, or know a little bit about programming. I've tried to keep this as straightforward as possible, even for non-programmers to roughly follow.
This project will involve writing a few "throw-away" scripts to parse and extract data, and my preferred language is Python. While I do all the scripts in Python 3 (note: Python 3 has some backwards incompatibilities with Python 2. My scripts might not run on Python 2), you can use whatever language you like. The final software will be done with JavaScript since it is a web page that uses the Google Maps API. (The final result is here: http://inventwithpython.com/sfmuni/
In general, by "throw-away" script I mean a script that is written in order to be run once to perform a task. Software such as Firefox or Angry Birds I want to keep around to run again and again, but a throw-away script I just need to automate a certain task. I'll still keep this script; I won't actually delete this script once I've run it, but I most likely won't ever need it again.
A note to beginning programmers who might feel like this project might be too advanced for them: even though I have years of experience programming, I still made many mistakes and went down a few blind alleys while putting this code together. Although it looks like I just sat down and typed out this code, just remember that this tutorial is the polished outcome of quite a bit of tenacious work. Don't be discouraged or intimidated, just keep at it!
Prior Art Search
The first part before we do any programming project is to see what else is already out there. It might be fun to reimplement something that's already out there, but by looking at what other people have done, we can get ideas for what we might want to do. Or you might find the exact software you wanted is already made, and can save yourself the trouble.
Doing a few Google Searches, I see that there's SF Live Bus, which gives a live feed of every bus's position using the Google Maps API and the NextBus API. But it doesn't show the routes on the maps like the system map does.
NextBus has outfitted the buses and trains of many municipal transit systems with GPS locators and provides a data feed of them. They also have an API that is well documented.
Other than that, I haven't really found anything like what I want to do specifically.
Decide on Features (and Non-Features)
Here's what I want the software to do:
- Use Google Maps with all the usual navigation controls that it provides, but all the Muni routes are overlaid on top of it.
- Also, have all the stops marked on the map.
Also, it's important to come up with a list of features you will not have. It's really easy to say, "Hey it'd be cool if it could do this..." and keep accumulating features and making the software more complicated. While good learning experiences for the programmer, half-finished projects are almost always useless for other people. Our system map software will not have:
- Display current position of the buses.
- Have bus predictions for the stops.
- Offer directions between locations.
I'll come up with new features as I make progress, but keeping the scope of the project from constantly expanding will prevent me from ending up with another half-finished project.
Research
There are four things I'll have to learn before I can create this:
- Get a list of all the bus routes for San Francisco Muni .
- Figure out the coordinates of the routes so that I can draw them on the map.
- Figure out the coordinates of all the stops in the city.
- Learn enough of the Google Maps API to create a map and draw lines and markers on it.
The NextBus site has a PDF that explains their public data feed. We can use that to figure out the coordinates for routes and stops. You don't have to read it, I'll be explaining what I do as I do it.
Getting a List of Routes
According to the NextBus PDF, sf-muni is the "agency name" (NextBus provides info for many different cities' bus systems) that we plug into the URL for the XML data feed. You can access http://webservices.nextbus.com/service/publicXMLFeed?command=routeList&a;=sf-muni to get XML text with all the routes. The XML looks like this:
<?xml version="1.0" encoding="utf-8" ?>

<body copyright="All data copyright San Francisco Muni 2014.">

<route tag="F" title="F-Market & Wharves"/>

<route tag="J" title="J-Church"/>

<route tag="KT" title="KT-Ingleside/Third Street"/>

<route tag="L" title="L-Taraval"/>

...
I need to extract the information in the tag and title attributes. I could just spend time copying & pasting this information, but instead I'll write a throw-away Python script (called getroutes.py to do this for me.
Download getroutes.py or view it online.
I've installed the Requests module to make downloading the XML data easier. The quick start page has a good intro in how to use it. To download a web page, you import requests and then call requests.get() to download the page. The requests.get() function returns a "request object" which has the webpage as a string in the text attribute. (The Requests module is much easier to use than Python's urllib2 module.)
I'll use the xml and pprint modules to turn the XML text file into a Python dictionary value that is saved to a file named routedata.py. I can pass a dictionary value to the pprint.pformat() function, and it will return a string of what that dictionary would look like typed as code.
I'm using Python code to generate Python code! This sounds complicated, but just keep in mind that a Python script is just a plain text file: Technically this is Python code that generates Python code: print("print('Hello world!')").
Download routedata.py or view it online.
I now have a routedata.py file that looks like this:
allRoutes = {'1': '1-California',

 '10': '10-Townsend',

 '108': '108-Treasure Island',

 '12': '12-Folsom/Pacific',

...
I won't actually run this script, but I'll import it for the allRoutes variable in future scripts. There are 81 routes listed in this dictionary.
The entire process has looked like this:
NextBus XML feed URL > getroutes.py processing > Dictionary in routedata.py
Getting Route Path Data
The NextBus PDF explaining their API says I can access a URL like http://webservices.nextbus.com/service/publicXMLFeed?command=routeConfig&a;=sf-muni&r;=N to get all the information about the N route. I just have to replace "N" with the other route names in the URL to get info for the other routes. Part of the XML at this URL looks like this:
<path>

<point lat="37.76017" lon="-122.50878"/>

<point lat="37.7603" lon="-122.50812"/>

<point lat="37.76039" lon="-122.50606"/>

<point lat="37.76052" lon="-122.50284"/>

<point lat="37.76068" lon="-122.49915"/>

<point lat="37.76083" lon="-122.49596"/>

</path>

<path>

<point lat="37.76493" lon="-122.45651"/>

<point lat="37.76537" lon="-122.45293"/>
Each <path> element has the <point> elements which have latitude and longitude data "that can be used to draw a route on a map." (according to the NextBus PDF.) The reason there are multiple <path> elements instead of one giant <path> element is also explained in the PDF:
"Due to the nature of the configuration there can be many separate paths, some of them overlapping. A map client should simply draw all of the paths. The paths are not necessarily in any kind of order so you should only connect the points within a path. You should not connect the points between two separate paths though."
So we'll need to write another script that downloads the XML for each of the 81 routes, parses it to get the path information, and then put it in a big Python dictionary. I want the Python dictionary to look something like this:
allRoutesPathData = {'N': [ [{'lon': XXX, 'lat': XXX}, {'lon': XXX, 'lat': XXX}, ...], ... ],

                     '1': [ [{'lon': XXX, 'lat': XXX}, {'lon': XXX, 'lat': XXX}, ...], ... ],

...
The dictionary's keys will be strings of the route name. The values will be lists of lists which represent each <path> element. This list will contain a series of dictionaries with keys 'lon' and lat for the coordinate points.
My getpathdata.py script will create the URL for each route, download the XML, parse the longitude and latitude data in the XML, and then produce a giant Python dictionary with this data in a file named munipaths.py.
Download getpathdata.py or view it online.
Download munipaths.py.
The output of this program is in munipaths.py and looks like this:
munipaths = {'1': [[{'lat': '37.78984', 'lon': '-122.43367'},

        {'lat': '37.78999', 'lon': '-122.4325'},

        {'lat': '37.79019', 'lon': '-122.43085'},

        {'lat': '37.79036', 'lon': '-122.42918'},

        {'lat': '37.79068', 'lon': '-122.42714'},

...
This process can be summarized as:
Each NextBus route URL > getpathdata.py processing > Dictionary in munipaths.py
Getting Route Stop Data
We'll also collect the stop information from the same XML feed that had the path information. According to the NextBus PDF, the attributes we'll be interested in are "title", "lat", "lon", and "stopId". I'll write a script to download and extract this data just like I did with the path data. I'll call this script getstopdata.py and make it from a modified getpathdata.py.
Download getstopdata.py or view it online.
Download munistops.py.
It outputs the giant Python dictionary to munistops.py, which looks like this:
munistops = {'1': [{'lat': '37.7954199',

        'lon': '-122.397',

        'stopId': '14015',

        'title': 'Clay St & Drumm St'},

       {'lat': '37.7945',

        'lon': '-122.3976099',

        'stopId': '16294',

        'title': 'Sacramento St & Davis St'},

...
This process can be summarized as:
Each NextBus route URL > getstopdata.py processing > Dictionary in munistops.py
Figure Out How Google Maps API Works
Okay! Now that we have all our data, we need to figure out how to draw it on Google Maps using their API. First, I'm going to start reading through the Google Maps API documentation. (You don't have to read it, I'll summarize.)
It starts off "This documentation is designed for people familiar with JavaScript programming and object-oriented programming concepts." So you'll have to know a bit of JavaScript to make use of it.
First, according to the guide, we have to sign up for a Google API key. This will require having a Google account. The instructions seem a bit out of date (Google has a new Dev Console site). From the APIs menu item on the left, I had to turn on "Google Maps API v3". Then I went to the Credentials menu item on the left, and clicked the "Create New Key" button and typed in "*.inventwithpython.com/*" and "inventwithpython.com/*" as the HTTP referers since this is where I'll host the map. (My inventwithpython.com site can optionally be www.inventwithpython.com, hence the two different referers.)
This gave me my API key, which for me was "AIzaSyAq1luszpXp057mCW_qifsvM-_fzCOf2Ok" (This key will only work on maps on the inventwithpython.com site, so you can't copy and paste it into your own apps. But getting your own API key is pretty easy.)
I'll host the map at http://inventwithpython.com/sfmuni in the index.html file (that way, the user won't have to type the "index.html" part of the URL).
You can view the final source HTML of index.html online.
I've copied their "Hello World" example, entering in my own API key and setting the "sensor" parameter to "false" (since this site won't use GPS to find the user's position).
I browsed to http://maps.google.com and did a search for "San Francisco, CA", and then clicking the "link" icon I got this URL: https://maps.google.com/?ll=37.7577,-122.4376&spn;=0.15906,0.308647&t;=m&z;=12. This gives a nice full view of San Francisco, and the ll=37.7577,-122.4376 part of the URL tells me the latitude and longitude values of the current map. I set the initial latitude and longitude of my Google Map to 37.7577 and -122.4376, and the initial zoom level to 12.
I've posted this first map at this URL: http://inventwithpython.com/sfmuni/firstmap.html. You can view the source HTML of this webpage online.
Drawing Lines on the Google Map
Next, I need to read up some more to figure out how to draw what Google Maps calls "polylines" on the map. I'll use polylines to draw out the routes. There is documentation for drawing shapes as well as an example using polylines on the Google site.
From the documentation, it looks like I have to have JavaScript code that creates a series of "google.maps.LatLng" objects which are used to create a "google.maps.Polyline" object. I can also set the color, opacity, and width (in pixels) of the polyline with the strokeColor, strokeOpacity, and strokeWeight parameters for the Polyline constructor.
After all that, I call setMap(map) on the Polyline object, where map is the Google map object that was used in the "Hello World" example and is in firstmap.html page
So I'm going to have to write Python code to generate the text of the JavaScript code. (Once again, I could do all this typing by hand, but that would take hours and hours.) But first, while I'll use the same width and opacity for each route, I don't want to use the same color for each route. I could just use the colors from the original Muni System Map PDF, but there's a lot of color reuse. Instead I'll use some standard RGB colors: #FF0000, #00FF00, #0000FF, #FFFF00, #00FFFF, #FF00FF, #800000, #008000, #000080, #808000, #008080, #800080
The JavaScript code I have to generate for each Polyline object looks something like this:
var routePath = new google.maps.Polyline({

    path: [new google.maps.LatLng(37.78984, -122.43367), ... ],

    strokeColor: '#FF0000',

    strokeOpacity: 1.0,

    strokeWeight: 2

  });

routePath.setMap(map);
I wrote generatePolylineJS.py to create this JavaScript code, which is outputted to a text file named polylineJS.js:
Download generatePolylineJS.py or view it online.
Download polylineJS.js.
The JavaScript code output is ready to be copied and pasted into our maps web page, and it looks like this:
var routePath = new google.maps.Polyline({

    path: [new google.maps.LatLng(37.77774, -122.43817), new google.maps.LatLng( ... ],

    strokeColor: '#00FF00',

    strokeOpacity: 1.0,

    strokeWeight: 2

  });

routePath.setMap(map);


var routePath = new google.maps.Polyline({

    path: [new google.maps.LatLng(37.77999, -122.42014) ...

...
I've copied and pasted all this text into my maps web page, index.html, at the end of the initialize() function. You can view what the file looks like at this point here: http://inventwithpython.com/sfmuni/secondmap.html (Right-click this link to save the HTML file.)
Look at how huge this html file is! Over 800 kb! I'm glad I wrote a script that could automatically grab the route coordinates from the NextBus feed and then generate the necessary JavaScript for me. If I had to somehow manually mark each of the latitude and longitude points for each of the routes, that would have taken weeks!
Reducing the File Size
There are 14,266 points in the web page now for all the routes. The web page file is about 800 kb in size, which will be slow to load for smart phones. Let's take out all the redundant code by simply placing the latitude and longitude numbers in a JavaScript object, and then have JavaScript code go through this object to create the Polyline objects. We'll have to write a Python script to generate this JavaScript code for us.
We want to go from this:
var routePath = new google.maps.Polyline({

    path: [new google.maps.LatLng(37.77774, -122.43817), new google.maps.LatLng( ... ],

    strokeColor: '#00FF00',

    strokeOpacity: 1.0,

    strokeWeight: 2

  });

routePath.setMap(map);


var routePath = new google.maps.Polyline({

    path: [new google.maps.LatLng(37.77999, -122.42014) ...

...
...to something like this:
var allData = {"38BX": [[37.78271,-122.4458,37.78537,-122.44643,37.79107,-122.40095,37.79117, ... (a lot more data here)

var routeColors = {"38BX": "#00FF00","9": "#008000", ...

var routeNames = ["38BX","9","8X", ...


for (var i = 0; i < routeNames.length; i++) { // loop over each route

    var routeName = routeNames[i];

    for (var j = 0; j < allData[routeName].length; j++) { // loop over each path on the route

        var curPath = allData[routeName][j];

        var polylinePoints = [];

        for (var k = 0; k < curPath.length; k += 2) { // loop over each point in the path

            polylinePoints.push(new google.maps.LatLng(curPath[k], curPath[k+1]));

        }

        var routePath = new google.maps.Polyline({

            path: polylinePoints,

            strokeColor: routeColors[routeName],

            strokeOpacity: 1.0,

            strokeWeight: 2

            });

        routePath.setMap(map);

    }

}
This will be much smaller since we only have the new google.maps.LatLng(...) and var routePath = new google.maps.Polyline(...) code typed once. The JavaScript code creates an array named polylinePoints that has google.maps.LatLng objects in it for the points on each path on each route. The routeColors JavaScript array will store the randomly-determined color to use for each route.
Also, I noticed that my data currently has a lot of redundant routes on it. For example, the 14 Mission bus route is the same as the 14L "Local" Mission and 14X "Express" Mission routes. I'll set up my new script to not include the following routes: 1AX, 1BX, 5L, 8AX, 8BX, 9L, 14L, 14X, 28L, 31AX, 31BX, 38L, 38AX, 38BX, 71L, K OWL, L OWL, M OWL, N OWL, T OWL. (Routes like the 82X stay because the original route 82 no longer exists.) Also, I later found out that routes 59, 60, 61, 30X, and NX are listed in the NextBus XML feed but are no longer in service.
This JavaScript code will be generated by our Python script (named generatePolylineJS2.py) and outputted to a file named polylineJS2.js. We can copy and paste this JavaScript code into our map web page.
Download generatePolylineJS2.py or view it online.
Download the output file, polylineJS2.js, or view it online.
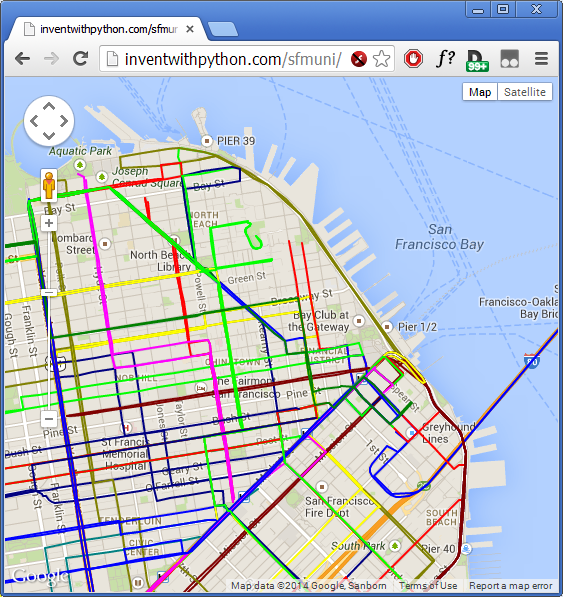
The new map web page is at thirdmap.html. It's the same as secondmap.html, except at 226 kb it's about 70% smaller, making it much faster to load.
Adding Mouseover Events to the Lines
The different colors don't tell us what the route numbers are. It'd be nice if this information showed up whenever we hovered the mouse over it. According to the Events documentation for Google Maps, we can just call addListener() on the google.maps.Polyline and pass them the string 'mouseover' and a JavaScript function to call when the mouse hovers over the polyline.
To display the route name, we can use an InfoWindow object that Google Maps provides. When the mouse hovers over a line, move the InfoWindow to the mouse cursor, and then open it and display the route name. When the mouse leaves a line (the 'mouseout' event) we want to close the InfoWindow.
When the event handling function is called, Google Maps will pass it a MouseEvent object with has a latLng property of where the mouse event happened. We can use that location to set the position of the InfoWindow.
After poking around the Google Maps documentation, here's the code I came up with to do this:
var routeNames = ["38BX", ... (a bunch more code)


var routeInfoWindow = new google.maps.InfoWindow({ // this info window shows the route name when the mouse hovers over a route line

  disableAutoPan: true

});


...(other code)...


        var routePath = new google.maps.Polyline({

            path: polylinePoints,

            strokeColor: routeColors[routeName],

            strokeOpacity: 1.0,

            strokeWeight: 2

            });


        (function(thisRouteName) { // making this into a closure so that "thisRouteName" keeps its value

          google.maps.event.addListener(routePath, 'mouseover', function(moevent) {

            routeInfoWindow.setPosition(moevent.latLng); // set the info window where the mouse is

            routeInfoWindow.setContent(thisRouteName);

            routeInfoWindow.open(map);

          });

        })(routeName);


        routePath.setMap(map);

...(rest of the map web page)...
I decided not to have code that closes the window on the mouseout event because then you have to get the mouse precisely on the super skinny line, which was less than ideal. Also, I realized that I could make these info windows have not just the text of the route name, but also make them into a link to the individual route maps on the Muni website. (Although since the URLs for these maps are named like http://www.sfmta.com/node/11329 instead of having names based off the route name, I had to copy and paste the links from my browser and into my code. The JavaScript I added looks like this:
var routeMapLinks = {"1":"11329", "10":"11341", "108":"11406", "12":"11342", "14":"11343", "16X":"11344", "17":"76586", "18":"11346", "19":"11347", "2":"11330", "21":"11348", "22":"11349", "23":"11350", "24":"11351", "27":"11352", "28":"11353", "29":"11355", "3":"11331", "30":"11356", "31":"11358", "33":"11359", "35":"11360", "36":"11361", "37":"11362", "38":"11363", "39":"11364", "41":"11365", "43":"11366", "44":"11367", "45":"11357", "47":"11368", "48":"11369", "49":"87351", "5":"11332", "52":"11371", "54":"11372", "56":"11373", "6":"11333", "66":"11377", "67":"11378", "71":"88001", "76X":"11379", "81X":"11381", "82X":"11382", "83X":"11383", "88":"73391", "8X":"72596", "9":"11339", "90":"11385", "91":"11386", "F":"11399", "J":"11387", "K":"71901", "KT":"69176", "L":"11398", "M":"11397", "N":"11388"};
I've made the code adjustments to the map web page and you can view it here: http://inventwithpython.com/sfmuni/fourthmap.html. You can view the source HTML online.
Adding Bus Stop Markers to the Map
Next, we want to add Google Map's markers for each of the stops. One slight problem with the data in munistops.py though: it has a list of stops for each route, but because some stops are used by multiple routes there's a lot of redundant information there. We need to make a dictionary where the keys are stops and the values hold the information for the stop (including a list of routes that the stop serves).
According to the Google Maps API documentation for markers, adding a marker to the map looks like this:
var marker = new google.maps.Marker({

    position: new google.maps.LatLng(, ),

    map: map,

    title: "Some Title Text"

    });
There's a slight problem. We have our bus stop data in a format where the keys are route names and the values are lists of stops. Since multiple routes use the same stops, we will end up with redundant bus stop markers on our map. We need to invert it so we have a Python dictionary of bus stops as keys and route names (and other info) as the values. I've written cleanup_stops.py to generate the JavaScript I need (it is outputted to stops_cleanedup.js).
Download cleanup_stops.py or view it online.
Download stops_cleanedup.js or view it online.
The map web page with stop markers is here: http://inventwithpython.com/sfmuni/fifthmap.html
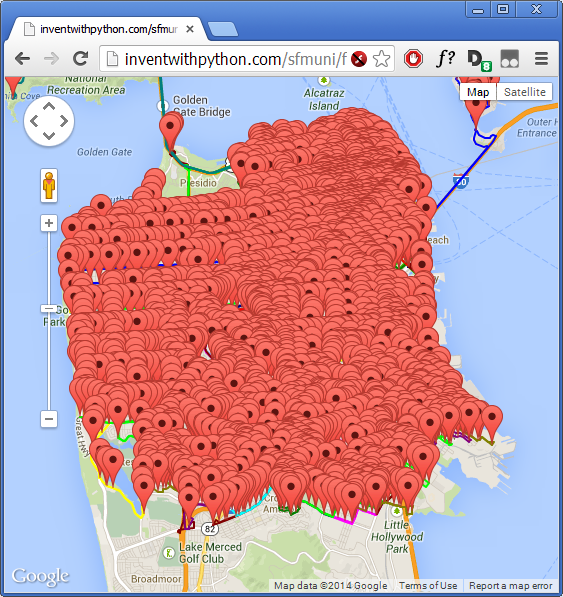
Wow. That looks horrible. I realized that I don't need another InfoWindow to appear when you click on the marker, because hovering the mouse over the marker will show a tooltip with the stop's name. But even after commenting that out, the sheer number of stops makes the map look terrible.
I could add code that makes a single route's stop markers appear when the mouse is over the route polyline. Or maybe the markers only show up once you are zoomed in enough. But I like the fourth map that didn't have the markers, so I'll just go with that. (Making bus stop markers appear and disappear on the map as the mouse hovers over the route polyline is left as an exercise for the reader.)
The final product is hosted at http://inventwithpython.com/sfmuni/
You can view the final source HTML online.
Summary
That's the entire product: a Google Map with the San Francisco Muni routes drawn over it. At the start of this project I had no experience with the Google Maps API and didn't know where I'd get the route info. I spent much more time reading documentation and experimenting than I did writing code, which is usually how projects go.
Here are the files in this tutorial:
- getroutes.py
- routedata.py
- getpathdata.py
- munipaths.py
- getstopdata.py
- munistops.py
- generatePolylineJS.py
- polylineJS.js
- generatePolylineJS2.py
- polylineJS2.js
- cleanup_stops.py
- stops_cleanedup.js
- index.html
My final secret: I play the AR game Ingress and the reason I wanted a better Muni system map was so that I could compare it to the Ingress map of portals in the game. The 71 bus through the Haight goes by a ton of portals, and it's nice to hit them all while sitting in a bus seat, and I was wondering if there were other routes similarly packed with portals. To do that, I needed a Muni system map that was easy to navigate. :)
I hope you enjoyed this tutorial. Please leave comments for any parts you have trouble understanding or you think need more explanation. Have fun and keep coding!